The Effect of Minimum Wages on Low-Wage Jobs: Cengiz, Dube, Lindner and Zipperer (2019), replicated and extended to 2024
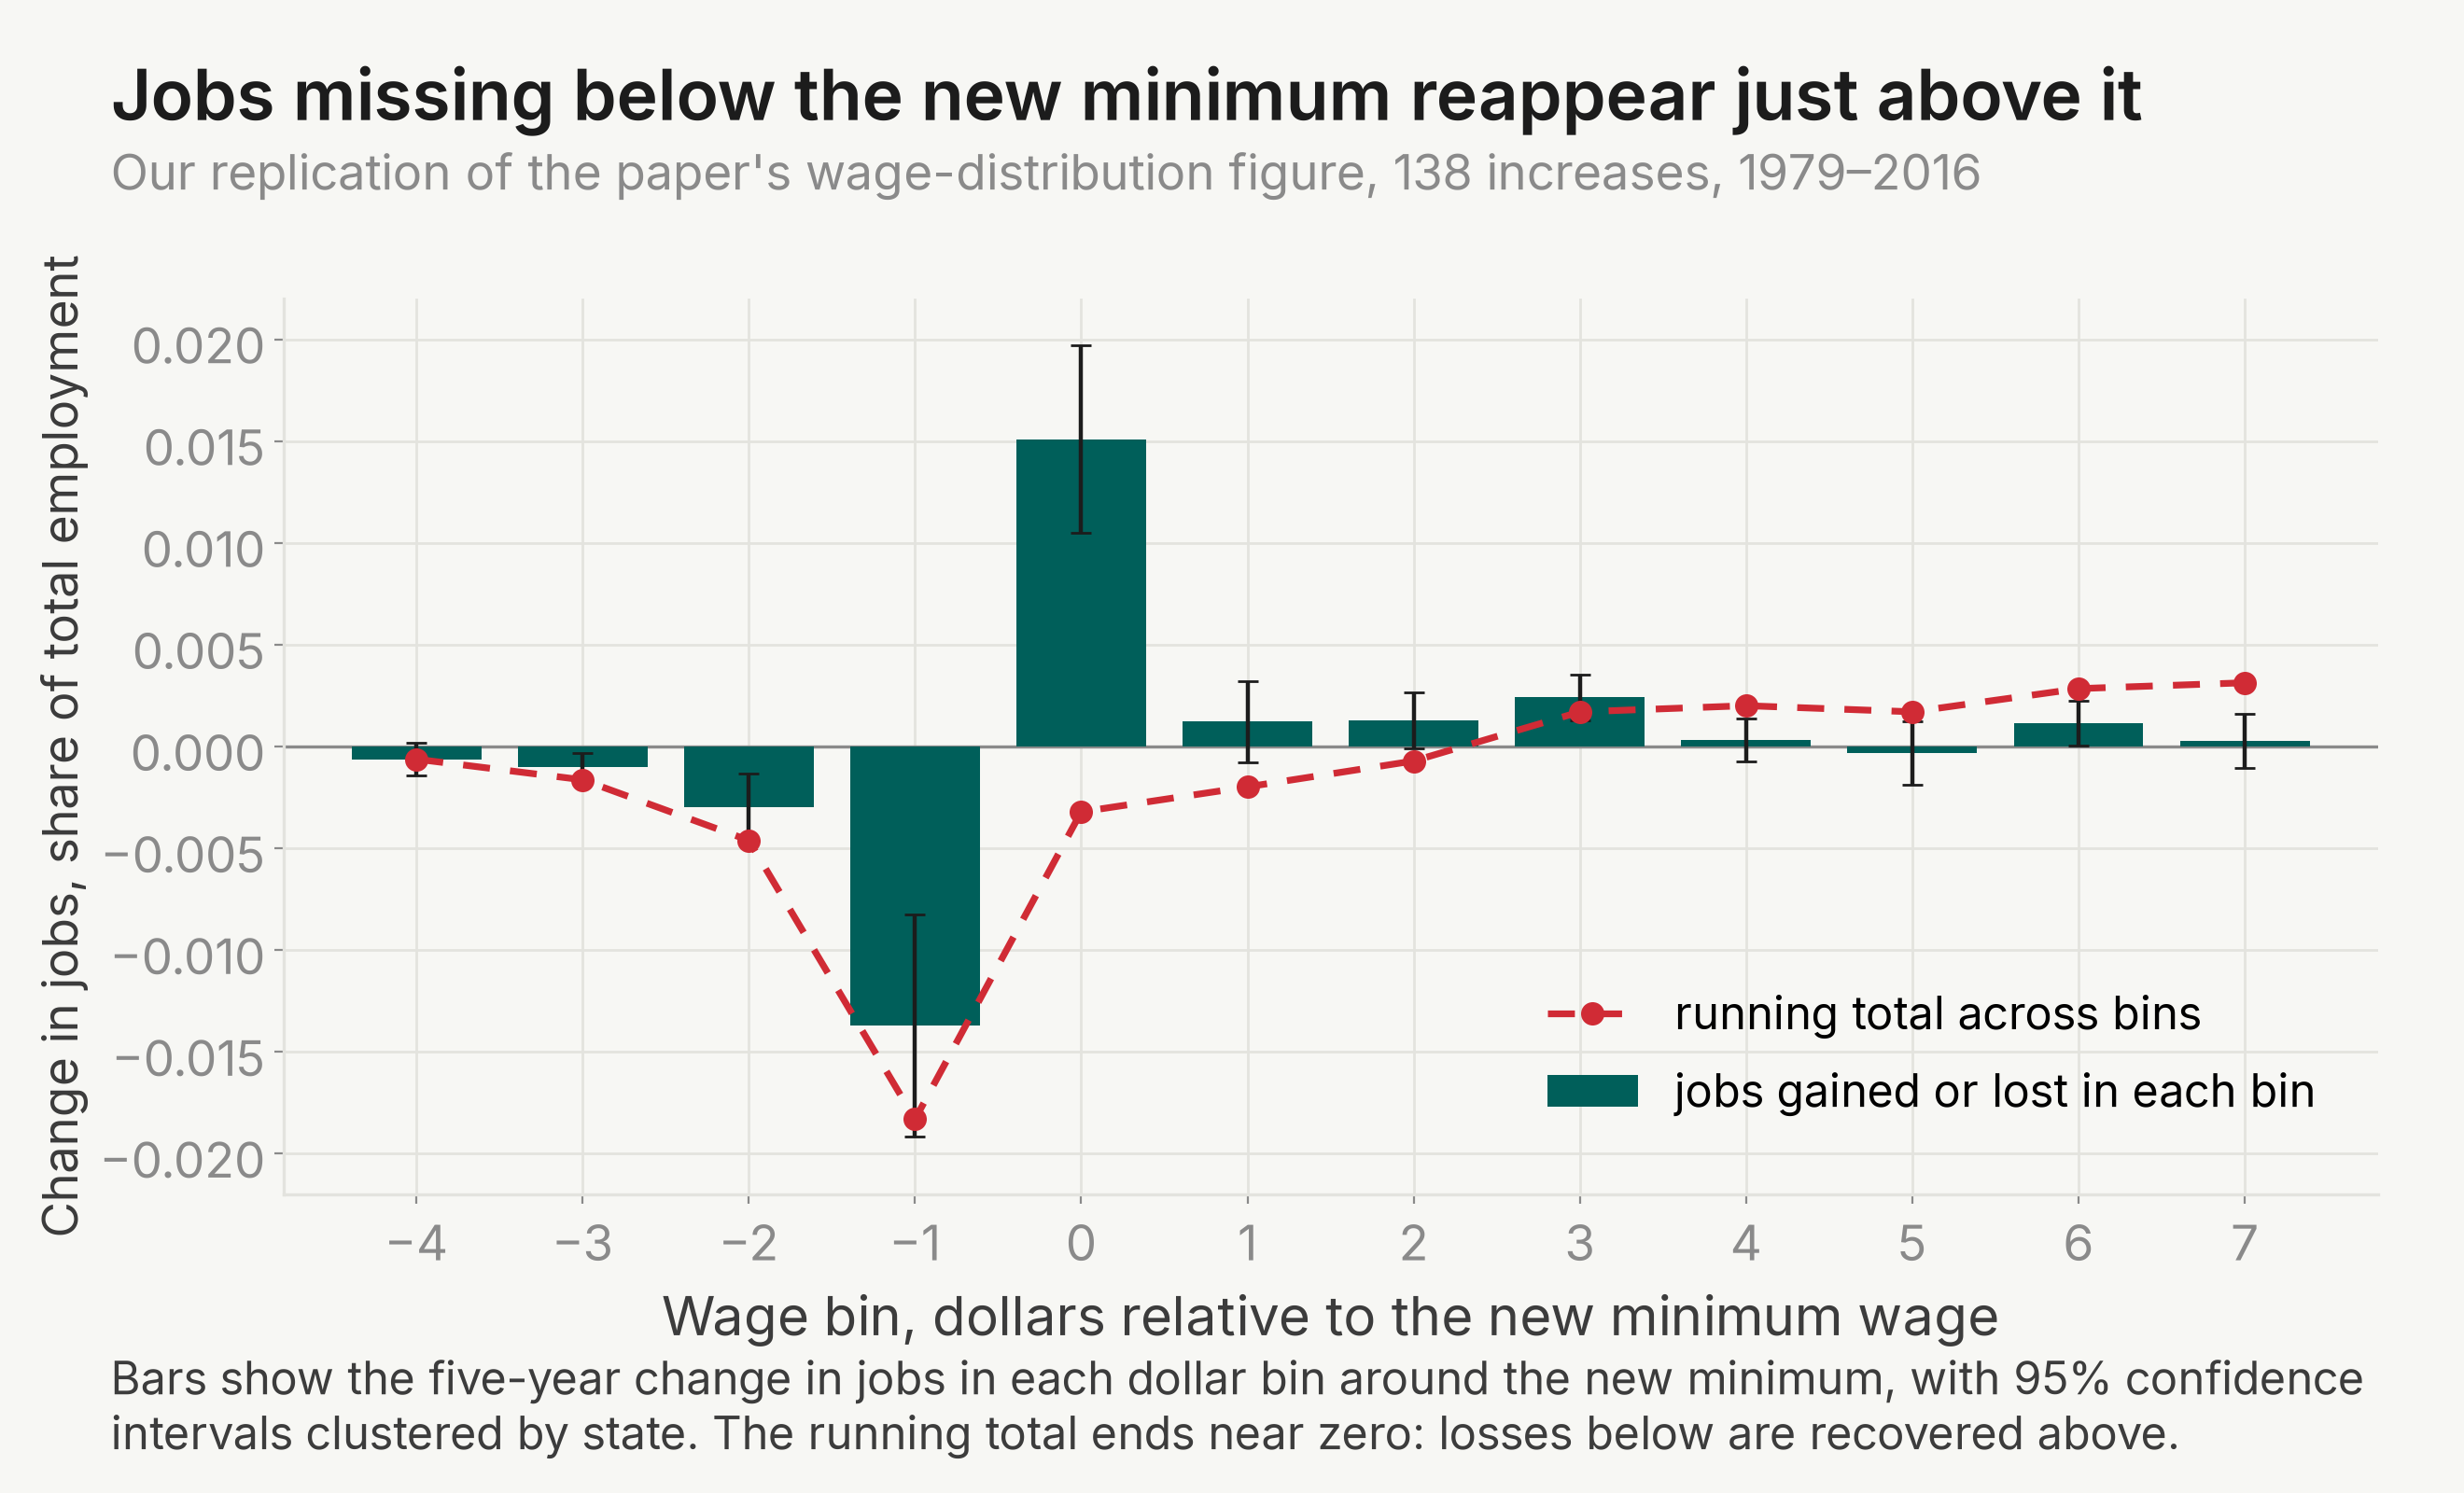
Cengiz, Dube, Lindner and Zipperer asked whether minimum wage increases destroy low-wage jobs. They counted jobs in 25-cent hourly wage bins from the CPS, 1979 to 2016, and around 138 state-level increases they measured the jobs vanishing below the new minimum against those appearing at or just above it. The two nearly cancel: affected workers' wages rose 6.8 percent while their employment changed by a statistically insignificant +2.8 percent.
The paper's main claims
- Jobs below the new minimum fall by 1.8 percent of employment (Δb = −0.018).
- Excess jobs at or just above it rise by 2.1 percent (Δa = 0.021).
- Affected employment changes by an insignificant +2.8 percent (s.e. 2.9).
- Affected wages rise 6.8 percent (s.e. 1.0).
- The own-wage employment elasticity is 0.41 (s.e. 0.43).
What we got when we re-ran it
We ran an R port (fixest) of the paper's Stata code on the paper's replication data and scored 0.98 over 22 counted claims: all 6 headline claims match, and of the 16 counted supporting claims 15 match and 1 is partial; two further claims were out of scope and are excluded from the count. A clean pass.
TABLE I. Impact of Minimum Wages on Employment and Wages (published / this replication)
| (1) | (2) | (3) | (4) | (5) | (6) | (7) | |
|---|---|---|---|---|---|---|---|
| Missing jobs below new MW (Δb) | −0.018*** / −0.018*** | −0.018*** / −0.018*** | −0.018*** / −0.018*** | −0.016*** / −0.016*** | −0.016*** / −0.016*** | −0.015*** / −0.015*** | . |
| (0.004) / (0.004) | (0.004) / (0.004) | (0.004) / (0.004) | (0.002) / (0.002) | (0.002) / (0.002) | (0.002) / (0.002) | . | |
| Excess jobs above new MW (Δa) | 0.021*** / 0.021*** | 0.018*** / 0.018*** | 0.020*** / 0.020*** | 0.016*** / 0.016*** | 0.014*** / 0.014*** | 0.015*** / 0.015*** | . |
| (0.003) / (0.003) | (0.003) / (0.003) | (0.003) / (0.003) | (0.002) / (0.002) | (0.003) / (0.003) | (0.003) / (0.003) | . | |
| %Δ affected wages | 0.068*** / 0.068*** | 0.057*** / 0.057*** | 0.068*** / 0.068*** | 0.049*** / 0.049*** | 0.043*** / 0.043*** | 0.050*** / 0.050*** | 0.065*** / 0.065*** |
| (0.010) / (0.010) | (0.010) / (0.010) | (0.012) / (0.012) | (0.010) / (0.010) | (0.010) / (0.010) | (0.011) / (0.011) | (0.010) / (0.010) | |
| %Δ affected employment | 0.028 / 0.028 | 0.000 / 0.000 | 0.022 / 0.022 | −0.002 / −0.002 | −0.019 / −0.019 | −0.000 / −0.000 | 0.027 / 0.027 |
| (0.029) / (0.029) | (0.023) / (0.023) | (0.021) / (0.021) | (0.021) / (0.021) | (0.021) / (0.021) | (0.023) / (0.023) | (0.028) / (0.028) | |
| Employment elasticity w.r.t. MW | 0.024 / 0.024 | 0.000 / 0.000 | 0.019 / 0.019 | −0.001 / −0.001 | −0.016 / −0.016 | −0.000 / −0.000 | 0.023 / 0.023 |
| (0.025) / (0.025) | (0.020) / (0.020) | (0.018) / (0.018) | (0.018) / (0.018) | (0.018) / (0.018) | (0.019) / (0.019) | (0.024) / (0.024) | |
| Emp. elasticity w.r.t. affected wage | 0.411 / 0.411 | 0.006 / 0.006 | 0.326 / 0.326 | −0.032 / −0.032 | −0.449 / −0.449 | −0.003 / −0.003 | 0.410 / 0.410 |
| (0.430) / (0.430) | (0.402) / (0.402) | (0.313) / (0.313) | (0.439) / (0.439) | (0.574) / (0.574) | (0.455) / (0.455) | (0.421) / (0.421) | |
| Jobs below new MW (b(−1)) | 0.086 / 0.086 | 0.086 / 0.086 | 0.086 / 0.086 | 0.086 / 0.086 | 0.086 / 0.086 | 0.086 / 0.086 | 0.086 / n.a. |
| %Δ MW | 0.101 / 0.101 | 0.101 / 0.101 | 0.101 / 0.101 | 0.101 / 0.101 | 0.101 / 0.101 | 0.101 / 0.101 | 0.101 / n.a. |
| Number of events | 138 / 138 | 138 / 138 | 138 / 138 | 138 / 138 | 138 / 138 | 138 / 138 | 138 / n.a. |
| Number of observations | 847,314 / 847,314 | 847,314 / 847,314 | 847,314 / 847,314 | 847,314 / 847,314 | 847,314 / 847,314 | 847,314 / 847,314 | 14,484 / n.a. |
| Number of workers in the sample | 4,694,104 / n.a. | 4,694,104 / n.a. | 4,694,104 / n.a. | 4,694,104 / n.a. | 4,694,104 / n.a. | 4,694,104 / n.a. | 4,694,104 / n.a. |
| Controls | (1) | (2) | (3) | (4) | (5) | (6) | (7) |
|---|---|---|---|---|---|---|---|
| Bin-state FE | Y | Y | Y | Y | Y | Y | |
| Bin-period FE | Y | Y | Y | ||||
| Bin-state linear trends | Y | Y | Y | Y | |||
| Bin-state quadratic trends | Y | Y | |||||
| Bin-division-period FE | Y | Y | Y | ||||
| State FE | Y | ||||||
| Year FE | Y |
Notes. Event study of equation (1), 138 state-level events, 1979–2016. Column (1) is the paper's benchmark; columns (2) to (6) add state trends and division-period effects; column (7) is the simpler state-quarter method with outcomes equal to jobs or the wage bill under $15 per hour. Standard errors, in parentheses, are clustered by state. Significance: * p<0.10, ** p<0.05, *** p<0.01. Published value first, our replicated value second; a dot marks a cell our pipeline does not emit (the column (7) memo rows and the workers row, see the fine print). The controls grid is reproduced from the paper.
The same analysis on today's data
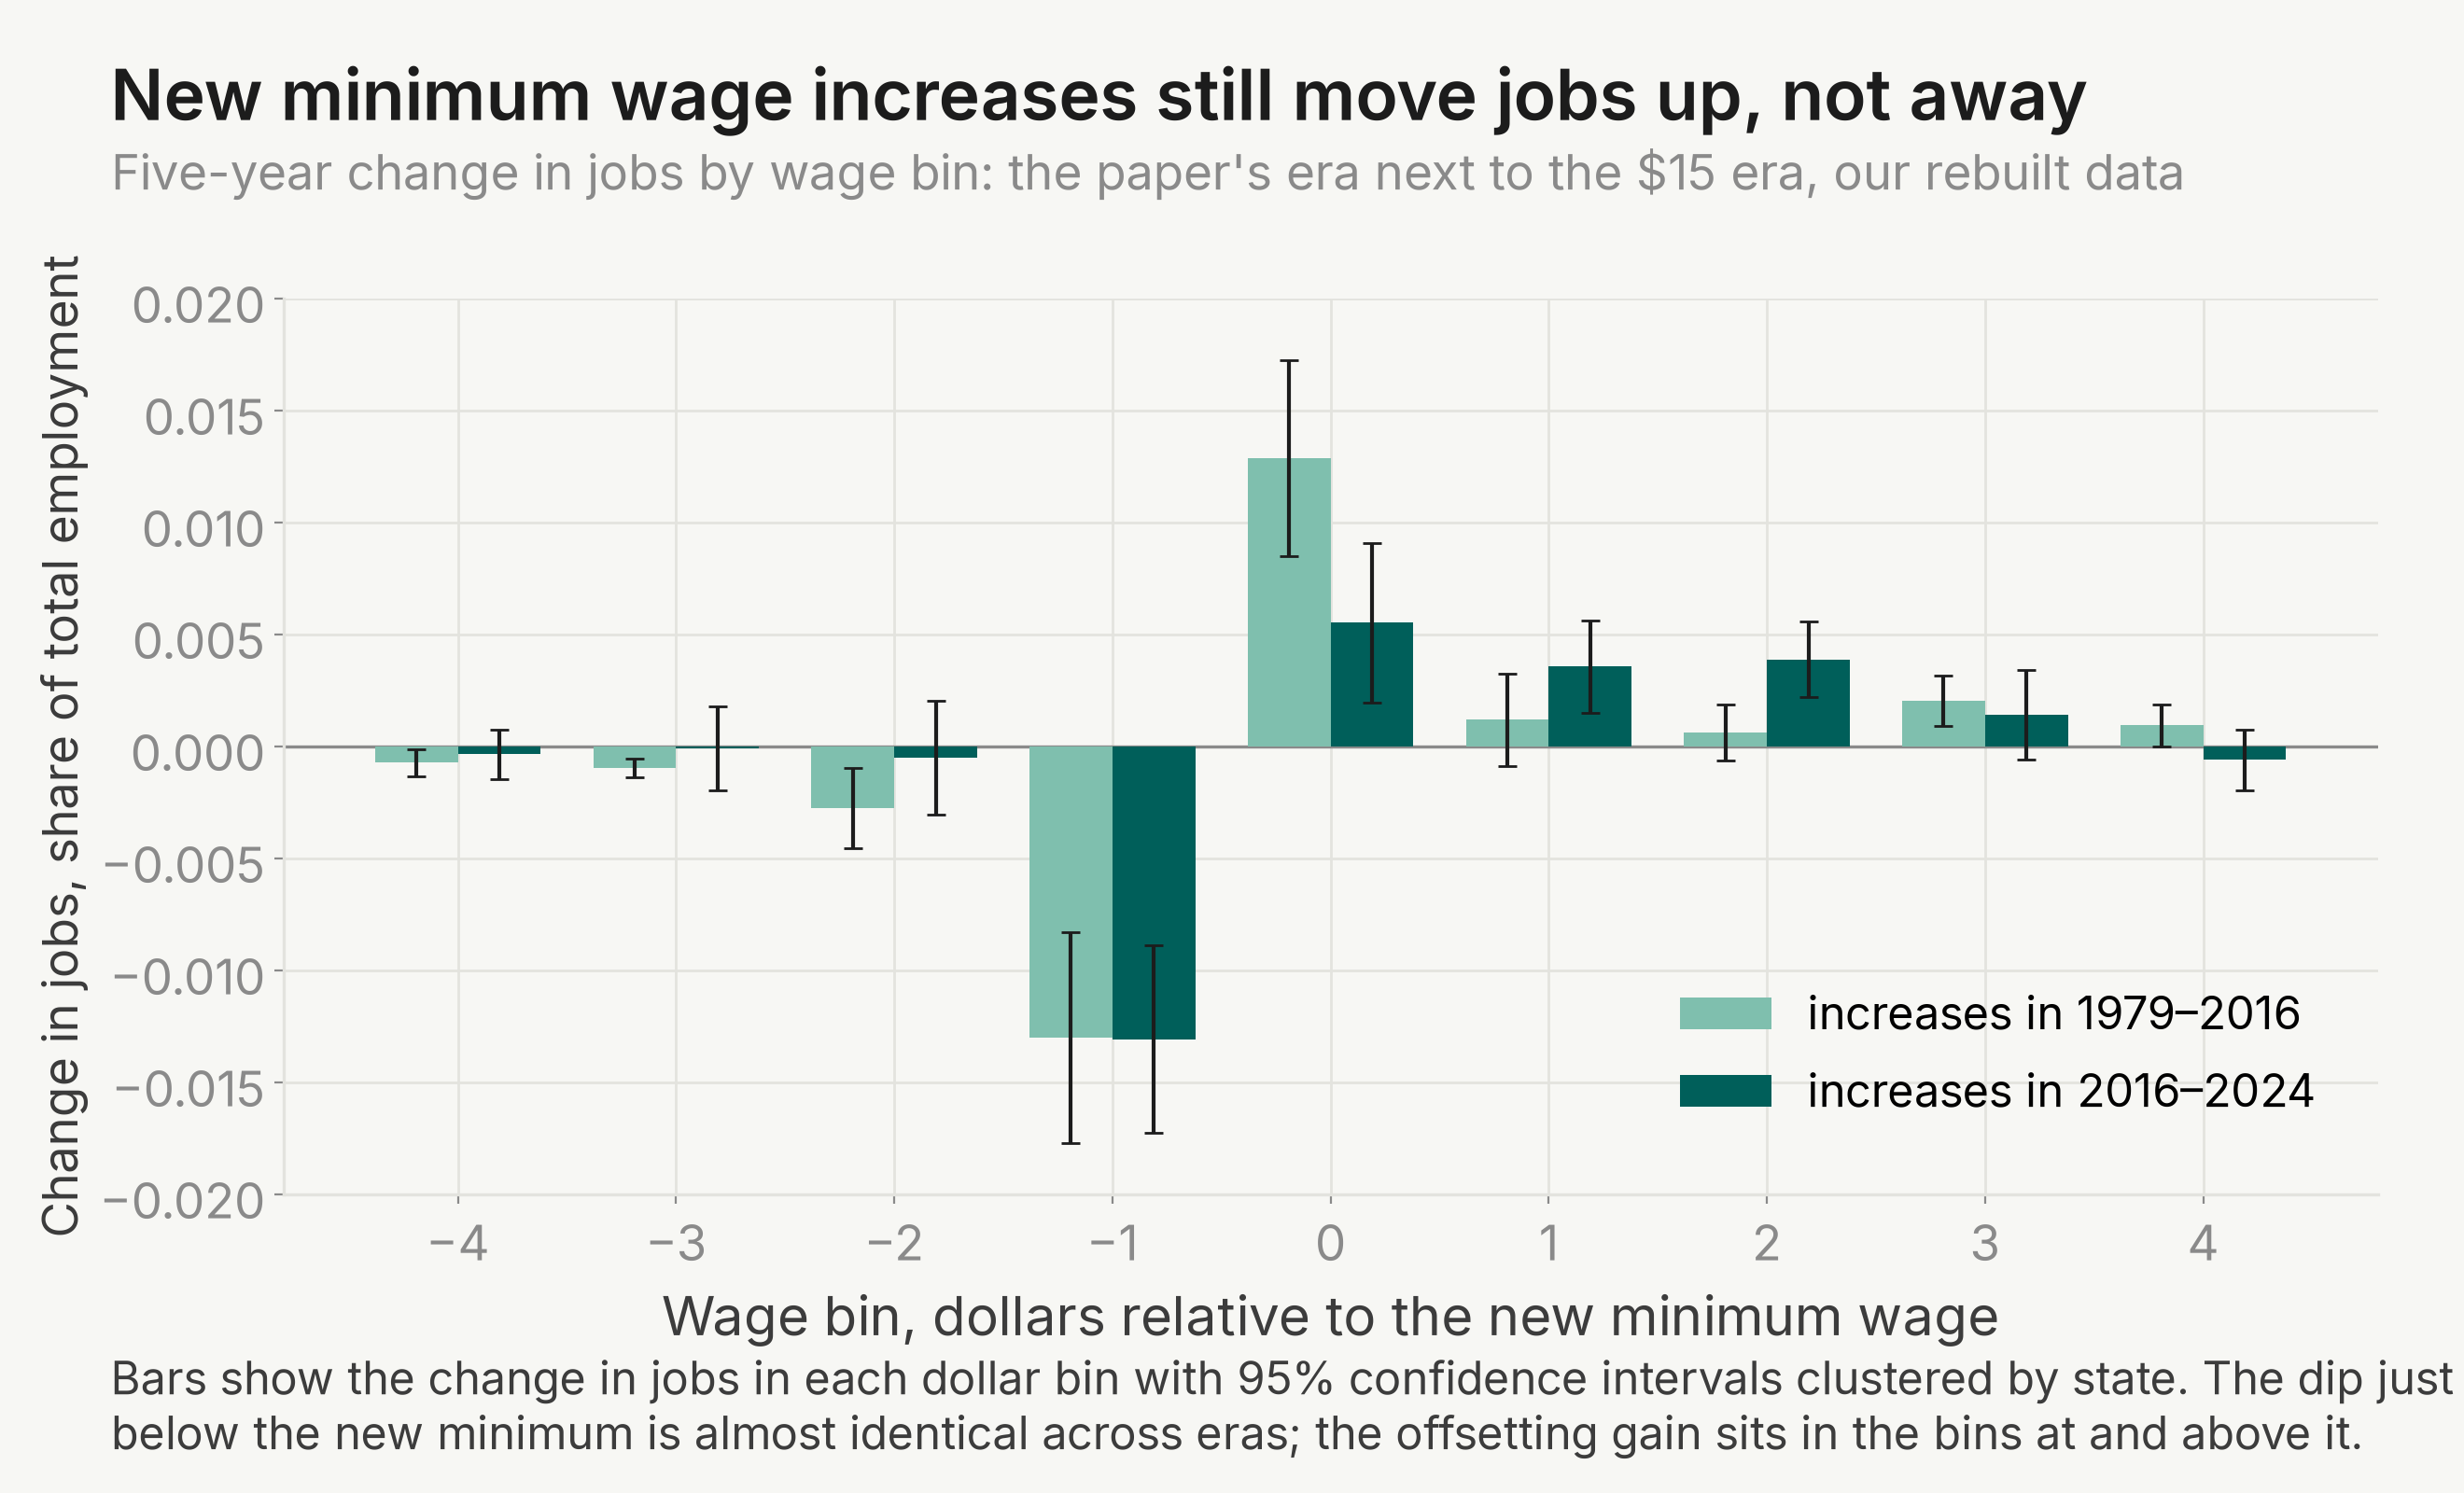
The paper's files stop in 2016, so we rebuilt the wage-bin panel from raw CPS microdata, extended the event list to 236 state-level increases through 2024, and re-estimated everything under the paper's benchmark specification. Pooled over all 236 events, affected employment comes out at −1.1 percent (s.e. 1.2); the most negative window is the high-bite 2016–2019 cohort of $15-era increases at −4.0 percent (s.e. 2.4), and the wage effect stays positive throughout. Every column re-estimates the paper's equation (1),
where the outcome is jobs per capita in wage bin and is the employment change in dollar bin relative to the new minimum, years after an increase, plus fixed effects, controls, and state-clustered standard errors.
Table I, extended: 236 state-level minimum wage events, 1979–2024 (all columns under the paper's column (1) specification)
| Anchor 1979–2016 (rebuilt) | Pooled 1979–2024 | 1979–1994 | 1995–2007 | 2008–2015 | 2016–2019 | 2020–2024 | |
|---|---|---|---|---|---|---|---|
| Missing jobs below new MW (Δb) | −0.018*** | −0.018*** | −0.013*** | −0.020*** | −0.015*** | −0.025*** | −0.013*** |
| (0.004) | (0.002) | (0.004) | (0.004) | (0.002) | (0.004) | (0.002) | |
| Excess jobs above new MW (Δa) | 0.021*** | 0.017*** | 0.012*** | 0.024*** | 0.013*** | 0.020*** | 0.014*** |
| (0.003) | (0.002) | (0.004) | (0.005) | (0.004) | (0.004) | (0.004) | |
| %Δ affected wages | 0.070*** | 0.046*** | 0.067*** | 0.092*** | 0.029 | 0.038*** | 0.044*** |
| (0.009) | (0.006) | (0.020) | (0.017) | (0.020) | (0.009) | (0.014) | |
| %Δ affected employment | 0.035 | −0.011 | −0.011 | 0.046 | −0.022 | −0.040 | 0.007 |
| (0.032) | (0.012) | (0.069) | (0.033) | (0.041) | (0.024) | (0.034) | |
| Employment elasticity w.r.t. MW | 0.029 | −0.012 | −0.006 | 0.031 | −0.025 | −0.064 | 0.008 |
| (0.027) | (0.013) | (0.040) | (0.022) | (0.046) | (0.038) | (0.042) | |
| Emp. elasticity w.r.t. affected wage | 0.493 | −0.244 | −0.168 | 0.497 | −0.773 | −1.061 | 0.153 |
| (0.443) | (0.277) | (1.063) | (0.344) | (1.921) | (0.769) | (0.752) | |
| Jobs below new MW (b(−1)) | 0.086 | 0.094 | 0.082 | 0.084 | 0.084 | 0.116 | 0.094 |
| %Δ MW | 0.103 | 0.087 | 0.143 | 0.124 | 0.075 | 0.072 | 0.077 |
| Number of events | 138 | 236 | 25 | 51 | 47 | 52 | 61 |
| Number of observations | 865,215 | 1,080,027 | 1,080,027 | 1,080,027 | 1,080,027 | 1,080,027 | 1,080,027 |
Notes. Our estimates on a wage-bin panel rebuilt from raw NBER MORG and Census CPS microdata with QCEW benchmarking; the anchor column is this rebuilt pipeline run on the paper's own period, not the paper's published numbers (those are in Table I above). All columns use the paper's column (1) specification with standard errors clustered by state. The five period windows come from one joint regression with shared fixed effects, which is why the observation count repeats across the window columns; they are not seven separate samples. Significance stars are ours, computed from the ratio of estimate to standard error with normal critical values (* p<0.10, ** p<0.05, *** p<0.01); the extension pipeline itself does not emit significance markers. Data vintages for the post-2016 years are in the fine print.
Notes
These are the judgment calls and data limits behind our numbers, so you can decide how much weight each result deserves.
- Stata is licence-gated in our container, so we ran an R/fixest port of the paper's Stata code; the cell-for-cell match is our evidence the port is faithful.
- The dots in Table I mark cells our pipeline doesn't emit; our figure data cover bins −4 to +7, so Figure 1's upper tail was verified structurally rather than numerically.
- The wage-change decomposition by demographic group and spillover shares graded partial, and two claims were out of scope; none touch Table I or Figure II.
- The extension anchor is a rebuild from raw microdata with QCEW benchmarking; on 1979–2016 it gives +3.5 (s.e. 3.2) against the paper's +2.8 (s.e. 2.9).
- Post-2016 vintages: CPI-U-RS spliced with CPI-U, Vaghul-Zipperer minimum wages then FRED plus statutory schedules, MORG through 2024 then the Basic Monthly CPS for 2025 (the shutdown leaves 2025q4 with November and December only).
The full replication working directory, including both extension studies, is public at github.com/SAI-living/living-minimum-wages.